Dashboard Configuration
Configuration Storage
Report and dashboard configurations are stored in the configured report store, not in the YAML configuration file. The report store supports DynamoDB and SQL backends.
The YAML file contains a top-level queries dict (used only by scheduled_queries references), scheduled_queries, a dashboard pointer, a reports section, a toolsets section, and a skillsets section — all used to seed the report store.
Each report has its own queries dict for named Cypher strings used by its panels.
To populate the report store from the YAML file during initial setup or development, use the CLI directly:
seizu seed --config path/to/reporting-dashboard.yaml
When working from the source checkout, make seed_dashboard is a development shortcut that seeds the bundled quickstart config:
make seed_dashboard
The dashboard key in the YAML file is a string that names a report in the reports section to use as the default dashboard:
dashboard: dashboard   # pointer to the "dashboard" entry in reports

reports:
  dashboard:
    name: Dashboard
    queries:
      cves-total: |-
        MATCH (c:CVE)
        RETURN count(c.id) AS total
    rows:
      - name: Overview
        panels:
          - cypher: cves-total       # reference to a named query in this report's queries dict
            type: count
            caption: Total CVEs
            w: 3
          - cypher: |-               # direct Cypher string — no named reference needed
              MATCH (c:CVE)
              RETURN count(c.id) AS total
            type: count
            caption: Total CVEs (direct)
            w: 3
To change the dashboard at runtime, use the Reports list in the UI (see below) or call the API directly:
curl -X PUT /api/v1/reports/<report_id>/dashboard
Managing Reports
Reports can be created, edited, and deleted at runtime through the Seizu UI without modifying the YAML file or restarting the service.
Permissions: Creating and editing reports requires the
reports:writepermission (seizu-editororseizu-admin). New reports and clones start as private drafts visible only to their owner. Owners withreports:writecan publish or unpublish their own reports; publishing updates report metadata and does not create a new version. Deleting reports requiresreports:delete. Setting the default dashboard requiresreports:set_dashboardand the selected report must be public. Pinning reports requiresreports:write. Restoring a historical version also requiresreports:write. Users with only theseizu-viewerrole can view public reports and history but will not see the New report button, and write/delete/restore actions in the ⋮ menu and version view will be disabled.
Reports list
Navigate to Reports in the sidebar to view all reports. From the list you can:
Click a report name to view it.
Open the ⋮ menu on any row to Edit, View history, Publish / Unpublish, Set as dashboard, Pin to sidebar / Unpin from sidebar, or Delete a report.
A Draft or Public badge shows the report visibility.
A Pinned badge is shown inline on reports that are pinned to the sidebar.
A Dashboard badge is shown inline on whichever report is currently set as the dashboard.
Creating a report
Click New report on the Reports list page, enter a name, and confirm. An empty report is created immediately and opened in edit mode so you can start adding rows and panels.
Version history
Every save creates a new numbered version; the full history is always available. To access it:
Click History (top-right when viewing a report), or
Choose View history from the ⋮ menu in the Reports list.
The history page lists all versions newest-first, showing the version number, save date, author, and save comment. The current (latest) version is labeled current.
Click a version number to open a read-only view of that version. From the version view you can:
Use the ← v_N_ / v_N_ → buttons in the toolbar to step through older and newer versions without returning to the list.
Click Restore this version to save the historical config as a new latest version. The button is disabled when viewing the current version, or when you do not have the
reports:writepermission.
Restoring a version never deletes history — it creates a new version whose config matches the restored one.
Editing a report
Click Edit report (top-right when viewing a report) or choose Edit from the ⋮ menu in the Reports list. Edit mode provides:
Named Queries — a collapsible section for defining reusable Cypher strings that panels can reference by key.
Rows — add, rename, and delete rows. Rows hold panels in a horizontal grid.
Panels — within each row, drag a panel by its body to reposition it, or grab the bottom-right resize handle to change both width and height. The pencil and trash icons open the panel editor or remove the panel. When a report has multiple rows, the move icon opens a row picker for moving a panel to another row.
Add panel — opens the panel editor where you select the panel type and fill in the relevant fields. The form adapts to show only the fields applicable to the chosen type, and exposes Width and Height sliders plus the Cypher / settings specific to that type.
Drag and resize changes are saved with the next report version.
Click Save version to commit your changes. Every save creates a new numbered version; existing versions are never overwritten.
Deleting a report
Choose Delete from the ⋮ menu in the Reports list and confirm. This permanently removes the report and all its versions. If the report is pinned, unpin it first. If the report is currently set as the dashboard, set another public report as the dashboard before deleting it.
Panels
Seizu supports various panel types that can be used to visualize graph data. See the Panel schema for more detailed info about specific fields.
Panel layout
Panels are positioned and sized on a 12-column grid (each row of the grid is 48 px tall). Every panel type accepts the same layout fields:
Field |
Description |
|---|---|
w |
Width in grid columns (1–12). |
h |
Height in grid rows. When unset, a per-type default is used (e.g. 4 for |
x |
Optional column index (0-based). When unset, panels pack left-to-right within the row. |
y |
Optional row index within the row’s grid. Reserved for future multi-row layouts; usually |
min_h |
Optional minimum height in grid rows. Enforced when the user resizes the panel. |
The markdown and vertical-table panel types also accept auto_height (boolean). When true, the panel renders at its natural content height instead of filling the assigned grid cell — useful for short, content-driven panels where clipping or scrolling looks wrong.
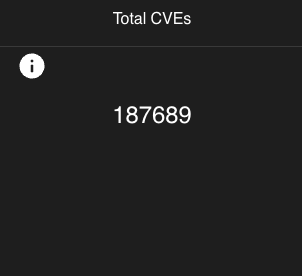
count
To simply display a count of a particular query, use a count panel.
Field |
Description |
|---|---|
cypher |
A cypher query to use for this panel. Either a key from the report’s |
details_cypher |
A cypher to use for displaying a table view of the data, in a details view. Either a key from the report’s |
params |
A list of parameters to pass into the query. See the PanelParam schema for more info. |
caption |
The caption to show as the title of this panel. |
type |
The type of panel. |
w, h, x, y, min_h |
Layout fields. See Panel layout. |
Example
        - cypher: cves
          details_cypher: cves-details
          caption: Total CVEs
          type: count
          w: 3
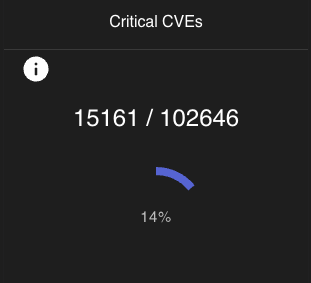
progress
To display a progress wheel, and x/y display of a particular query, use a progress panel.
By default, this panel will color the progress data based on a threshold of <70% error, >70% <100% primary, 100% success.
Field |
Description |
|---|---|
cypher |
A cypher query to use for this panel. Either a key from the report’s |
details_cypher |
A cypher to use for displaying a table view of the data, in a details view. Either a key from the report’s |
params |
A list of parameters to pass into the query. See the PanelParam schema for more info. |
caption |
The caption to show as the title of this panel. |
type |
The type of panel. |
threshold |
The lower threshold percentage to consider this result an error. Set to |
w, h, x, y, min_h |
Layout fields. See Panel layout. |
Example
        - cypher: cve-by-severity
          details_cypher: cve-by-severity-details
          params:
            - name: severity
              value: CRITICAL
          caption: Critical CVEs
          type: progress
          threshold: 0
          w: 3
pie
To display a pie graph, use a pie panel.

Field |
Description |
|---|---|
cypher |
A cypher query to use for this panel. Either a key from the report’s |
details_cypher |
A cypher to use for displaying a table view of the data, in a details view. Either a key from the report’s |
params |
A list of parameters to pass into the query. See the PanelParam schema for more info. |
caption |
The caption to show as the title of this panel. |
type |
The type of panel. |
pie_settings |
An object of settings specific to pie panels. |
pie_settings.legend |
Orientation of the legend. |
w, h, x, y, min_h |
Layout fields. See Panel layout. |
Example
        - cypher: cves-by-severity-as-rows
          caption: Critical CVEs
          type: pie
          pie_settings:
            legend: column
          w: 3
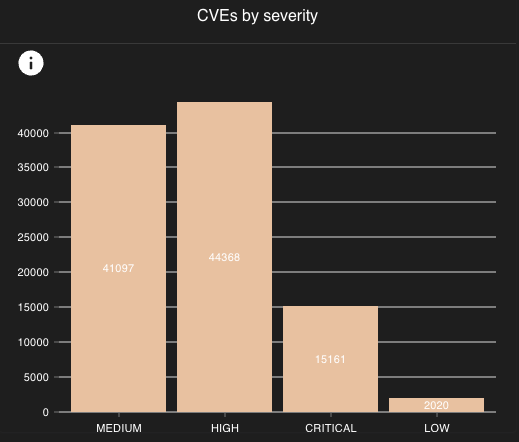
bar
To display a bar graph, use a bar panel.
Field |
Description |
|---|---|
cypher |
A cypher query to use for this panel. Either a key from the report’s |
details_cypher |
A cypher to use for displaying a table view of the data, in a details view. Either a key from the report’s |
params |
A list of parameters to pass into the query. See the PanelParam schema for more info. |
caption |
The caption to show as the title of this panel. |
type |
The type of panel. |
bar_settings |
An object of settings specific to bar panels. |
bar_settings.legend |
Orientation of the legend. |
w, h, x, y, min_h |
Layout fields. See Panel layout. |
Example
        - cypher: cves-by-severity-as-rows
          caption: Critical CVEs
          type: bar
          bar_settings:
            legend: column
          w: 3
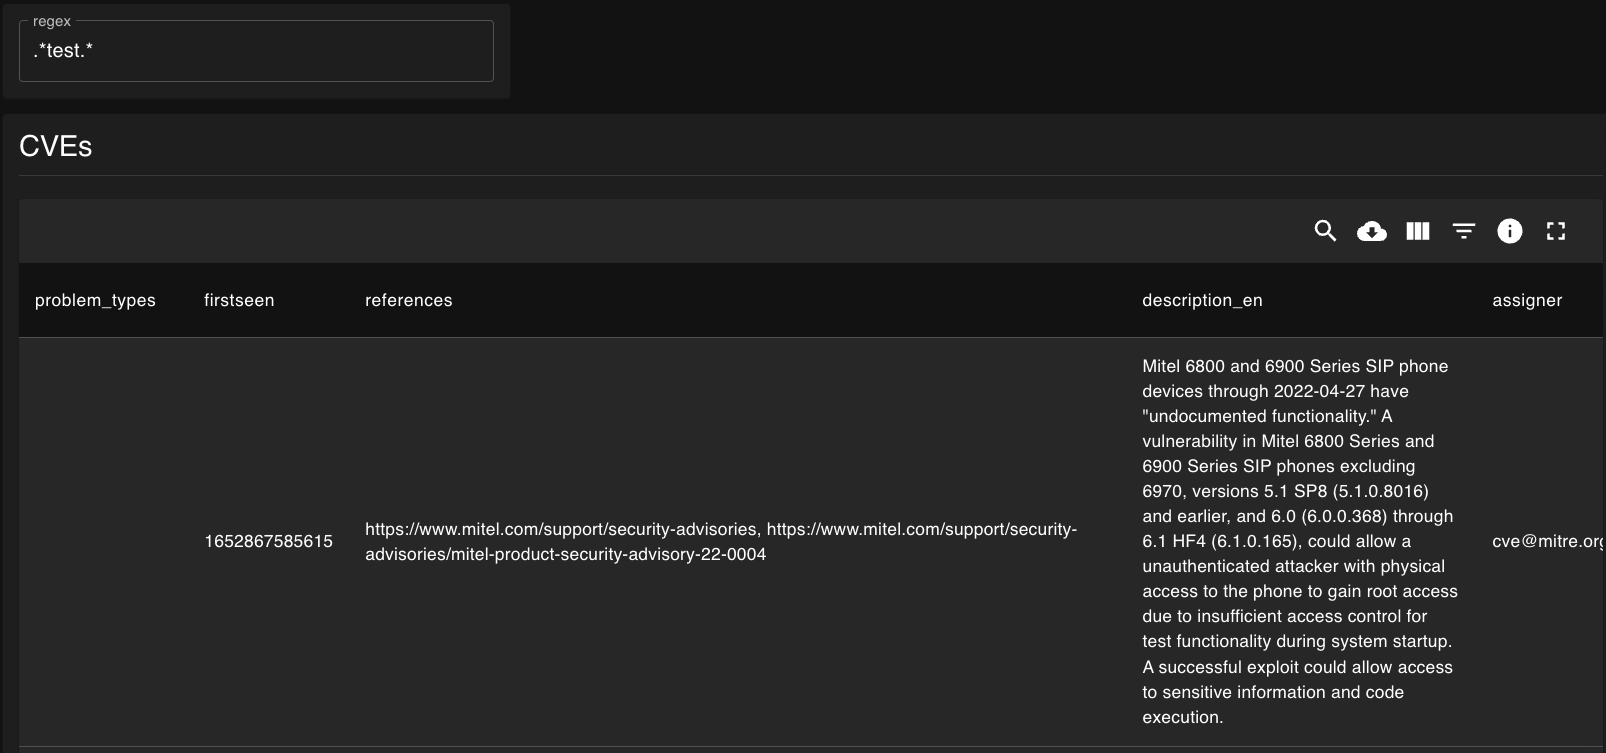
table
To display rows in a paged table, use a table panel.

The table panel auto-detects columns from the query results. It supports three return formats:
Named columns —
RETURN n.name AS name, n.org AS org(explicitcolumnsconfig maps to these)Map —
RETURN {name: n.name, org: n.org}(or with any alias, e.g.AS row)Node —
RETURN n(properties are unwrapped automatically)
When columns is specified in the panel config, those column names are read directly from the record keys.
Field |
Description |
|---|---|
cypher |
A cypher query to use for this panel. Either a key from the report’s |
columns |
Optional list of |
params |
A list of parameters to pass into the query. See the PanelParam schema for more info. |
caption |
The caption to show as the title of this panel. |
type |
The type of panel. |
w, h, x, y, min_h |
Layout fields. See Panel layout. |
Example
      - name: CVEs
        panels:
          - cypher: cve-search
            params:
              - name: cveId
                input_id: cve-id-autocomplete-input
            type: table
            w: 12
vertical-table
To display rows in a less-dense, vertical per-row view, use a vertical-table panel.
Note: the caption per-row is set via the table_id field, and if unset, will display undefined

Supports the same return formats as the table panel (named columns, map, or bare node).
Field |
Description |
|---|---|
cypher |
A cypher query to use for this panel. Either a key from the report’s |
params |
A list of parameters to pass into the query. See the PanelParam schema for more info. |
caption |
The caption to show as the title of this panel. |
type |
The type of panel. |
table_id |
The attribute in the result row to use as a caption for each row. If not set, row captions will show as |
w, h, x, y, min_h |
Layout fields. See Panel layout. |
auto_height |
When |
Example
      - name: CVEs
        panels:
          - cypher: cve-search
            params:
              - name: cveId
                input_id: cve-id-autocomplete-input
            type: vertical-table
            table_id: id
            w: 12
graph
To display graph data as an interactive node-link diagram, use a graph panel.

The panel has three tabs:
Graph — interactive node-link visualization. Only shown when the query returns graph-compatible data (see formats below).
Table — tabular view of the raw results. Always available. Columns are auto-detected from the result shape.
Raw — JSON dump of the full API response. Always available.
Clicking a node or relationship opens a collapsible detail panel on the right showing its properties. Clicking the canvas background deselects and returns to a graph summary view. The detail panel can also be toggled via the info icon at the top of the toggle handle.
The Graph tab supports two query return formats:
Option 1 — explicit map (full control over labels and grouping):
MATCH (org:GitHubOrganization)-[:OWNER]->(repo:GitHubRepository)
WITH
  collect(DISTINCT {id: id(org), label: org.id, group: 'Org'}) +
  collect(DISTINCT {id: id(repo), label: repo.name, group: 'Repository'}) AS nodes,
  collect({source: id(org), target: id(repo), type: 'OWNER'}) AS links
RETURN {nodes: nodes, links: links}
Option 2 — RETURN path (simplest; labels use the node_label property, defaulting to name then node id):
MATCH path = (:GitHubOrganization)-[:OWNER]->(:GitHubRepository)
RETURN path LIMIT 100
If the query does not return graph-compatible data (e.g. RETURN n or a plain property query), the Graph tab is hidden and the Table tab is shown by default.
Field |
Description |
|---|---|
cypher |
A cypher query to use for this panel. Either a key from the report’s |
params |
A list of parameters to pass into the query. See the PanelParam schema for more info. |
caption |
The caption to show as the title of this panel. |
type |
The type of panel. |
graph_settings |
An object of settings specific to graph panels. |
graph_settings.node_label |
The node property to display as the node label. Defaults to |
graph_settings.node_color_by |
The node property to use for color grouping. Defaults to |
w, h, x, y, min_h |
Layout fields. See Panel layout. |
Example
        - cypher: github-org-repos
          caption: GitHub Repositories
          type: graph
          graph_settings:
            node_label: name
            node_color_by: group
          w: 12
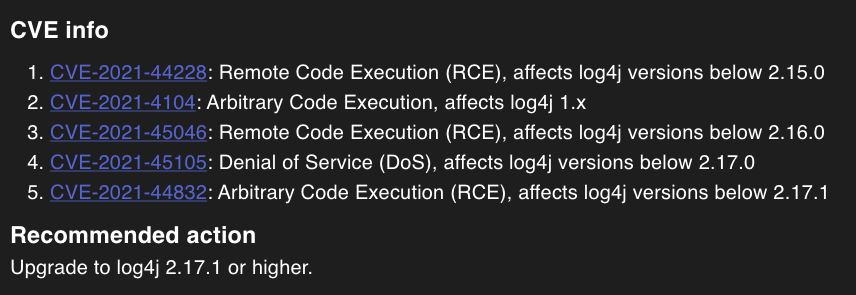
markdown
To render markdown, use a markdown panel.
Markdown panels are rendered with Markdoc, a Markdown-based authoring framework with first-class support for variables and tags.
Standard Markdown works as you’d expect — bold, italic, headings, ordered and unordered lists, links, code spans, fenced code blocks, and tables.
Tables render using MUI components with themed borders and a highlighted header row.
Heading levels in the Markdown source are shifted down by one (## renders as <h3>, etc.) so they fit naturally within the panel hierarchy.
The WYSIWYG editor recognizes Markdoc variable syntax and displays each variable as an inline chip. Use the Insert variable button in the editor toolbar to insert a reference to one of the report’s inputs.
Field |
Description |
|---|---|
markdown |
The markdown content to render. Supports Markdoc variables, tags, and standard Markdown (headings, lists, links, code, tables). |
type |
The type of panel. |
w, h, x, y, min_h |
Layout fields. See Panel layout. |
auto_height |
When |
Variables
Report inputs are exposed as Markdoc variables. Reference an input by its input_id, prefixed with $:
Showing CVEs at severity {% $cve-severity-autocomplete-input %} or higher.
The compact form {%$input_id%} (no whitespace) is also accepted, and is what the Insert variable toolbar produces. Use the compact form inside markdown link URLs — markdown-it’s link parser bails on URLs that contain spaces, so the spaced form {% $... %} would prevent [label](https://example.com/{% $foo %}) from being recognized as a link at all.
When the user changes the input, the markdown re-renders with the new value. Inputs that are unset (cleared, or with no default) are omitted from the variables map — see Conditionals for how to branch on this.
Variables in link and image URLs
Variables can be interpolated into the href of a link or the src of an image:
[{%$github_org%}](https://github.com/{%$github_org%})

A few rules apply:
Use the compact form
{%$name%}inside the URL (markdown-it cannot parse a URL that contains spaces).If you prefer the spaced form, wrap the URL in angle brackets:
[label](<https://github.com/{% $foo %}>). Both produce the same output.URLs whose value came from variable substitution are validated against an allowlist of
http://,https://,mailto:,tel:, plus relative URLs (no scheme) and safe image data URIs (data:image/{gif,png,jpeg,webp}). Anything else — including custom OS protocol handlers likeslack://,vscode://, or any future scheme — resolves to#. The allowlist applies only when a variable changed the URL; static editor-authored URLs (e.g.,[chat](slack://channel-id)with no variables) pass through unchanged.
Conditionals
Markdoc’s {% if %} / {% else /%} / {% /if %} tags let you show different content based on whether an input is set or matches a value:
{% if not($org) %}
Select a GitHub organization to view its repositories.
{% else /%}
Repositories owned by **{% $org %}**:
{% /if %}
Markdoc’s truthiness rules differ from JavaScript: only null, undefined, and false are falsy — empty strings and 0 are truthy. Seizu omits unset/empty inputs from the variables map so not($input_id) evaluates to true when the input is cleared.
You can also compare values:
{% if equals($severity, "CRITICAL") %}
**Action required**: critical findings present.
{% /if %}
Other Markdoc features
Markdoc supports a richer authoring vocabulary than vanilla Markdown — function calls (equals, and, or, not, default), the {% partial %} tag for content reuse, and custom tag schemas. Seizu does not register any custom tags or partials by default; you get the standard Markdoc surface plus the $input_id variables described above.
For the full Markdoc syntax reference and feature list, see the Markdoc documentation.
Example
          - markdown: |-
              ## CVE info
              {% if not($cve-severity-autocomplete-input) %}
              Select a CVE severity to filter the list below.
              {% else /%}
              Showing **{% $cve-severity-autocomplete-input %}** CVEs:

              1. [CVE-2021-44228](https://security.snyk.io/vuln/SNYK-JAVA-ORGAPACHELOGGINGLOG4J-2314720): Remote Code Execution (RCE), affects log4j versions below 2.15.0
              1. [CVE-2021-45046](https://security.snyk.io/vuln/SNYK-JAVA-ORGAPACHELOGGINGLOG4J-2320014): Remote Code Execution (RCE), affects log4j versions below 2.16.0
              1. [CVE-2021-45105](https://security.snyk.io/vuln/SNYK-JAVA-ORGAPACHELOGGINGLOG4J-2321524): Denial of Service (DoS), affects log4j versions below 2.17.0
              {% /if %}

              ## Recommended action
              Upgrade to log4j 2.17.1 or higher.
            type: markdown
            w: 12
Named Queries
Reports can define a queries dict of named Cypher strings.
Panel cypher and details_cypher fields are resolved against this dict at render time.
If the field value is not a key in the dict, it is used as a literal Cypher string — allowing panels to embed queries directly without adding them to the queries dict first.
reports:
  dashboard:
    name: Dashboard
    queries:
      cves-total: |-
        MATCH (c:CVE)
        RETURN count(c.id) AS total
    rows:
      - name: Overview
        panels:
          # Named reference — resolved from the queries dict above
          - cypher: cves-total
            type: count
            caption: Total CVEs
            w: 3
          # Direct Cypher string — no entry in queries needed
          - cypher: |-
              MATCH (c:CVE)
              RETURN count(c.id) AS total
            type: count
            caption: Total CVEs (direct)
            w: 3
Inputs
Reports can define inputs that can be used to pass parameters into queries used in panels in the report. These will be rendered at the top of the report, in the order specified in the configuration.
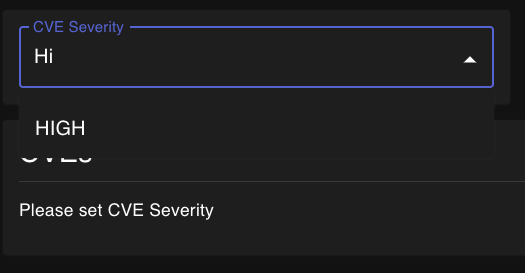
autocomplete
An autocomplete input can be used to use results queried from the graph as inputs to panels.
End-users can select through a dropdown list of the values, or can type to search/autocomplete a value.
Field |
Description |
|---|---|
input_id |
An ID for this input, that can be referenced from the params section of a panel. |
cypher |
A cypher query used to return the relevant data. This is not a reference to a query, but the actual query to run. It’s recommended to use |
default |
A dictionary with the default |
type |
The type of input. |
size |
The width of this input. |
Example
      - input_id: cve-severity-autocomplete-input
        cypher: >-
          MATCH (c:CVE)
          RETURN DISTINCT c.base_severity AS value
        label: CVE Severity
        type: autocomplete
        size: 2
text
A text input can be used for user-defined input for panel query parameters.
Panel re-renders are debounced: connected panels only update 300 ms after the user stops typing, rather than on every keystroke.
Field |
Description |
|---|---|
input_id |
An ID for this input, that can be referenced from the params section of a panel. |
default |
A dictionary with the default |
type |
The type of input. |
size |
The width of this input. |
Example
      - input_id: cve-id-regex
        label: Regex
        type: text
        size: 2
Details Data
All panel types with a cypher query have an info button that shows extra details about the panel, such as the query used, the parameters to the query, metrics that may be pushed with it, etc.
For count, progress, pie, bar, graph, and vertical-table panels, the info button appears in the top-right corner of the panel and is only visible on hover.
For table panels the info button is always visible, inline with the panel header.
Non-table panel types that also have a details_cypher configured will show a data drill-down table as the first tab in the details view.
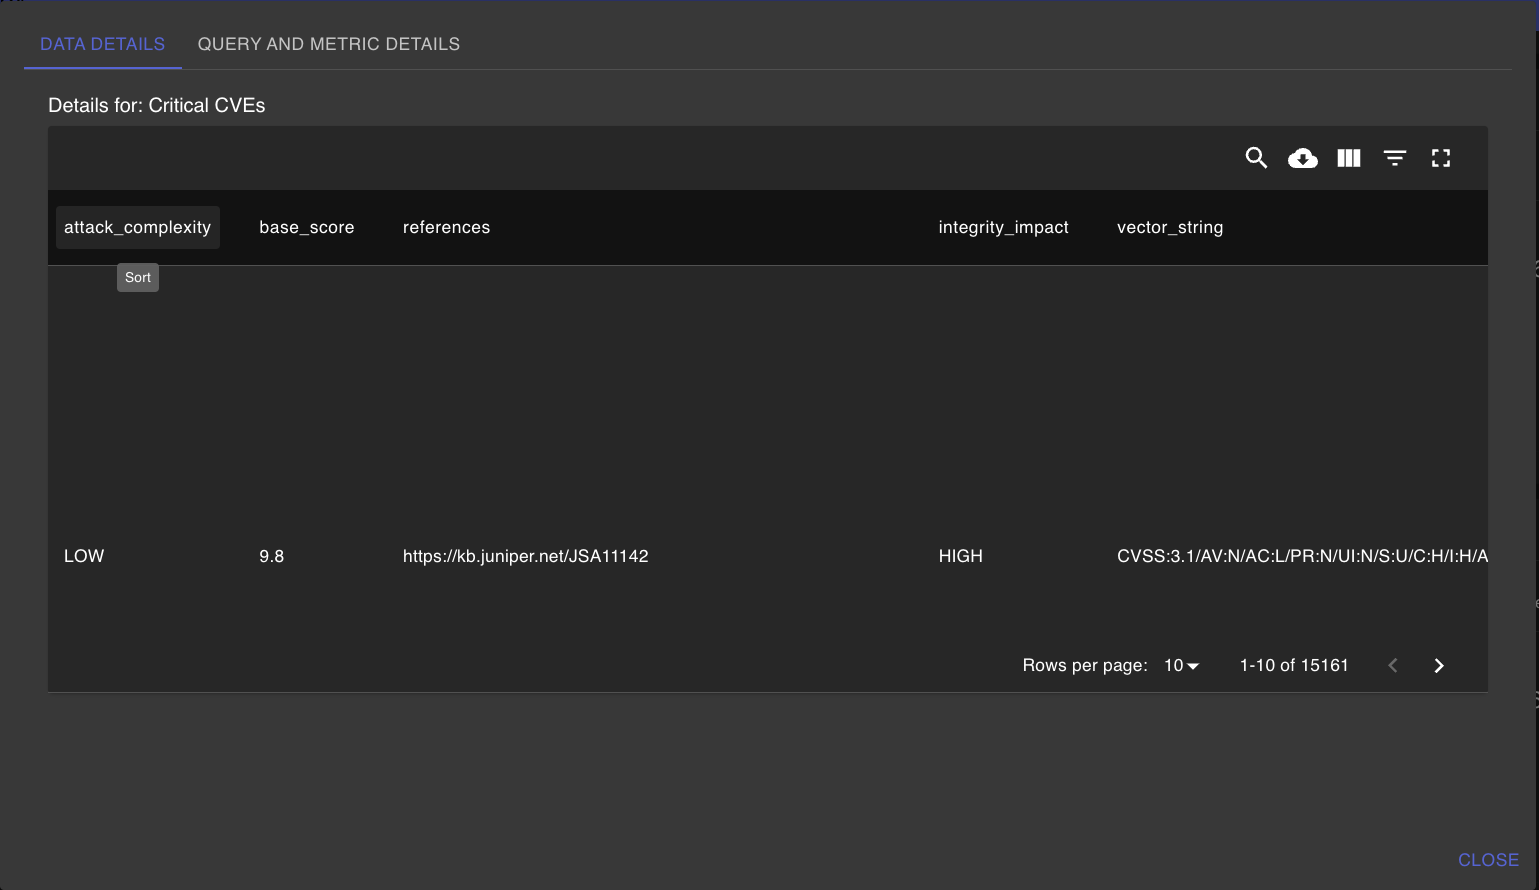
Use details_cypher when a summary panel should let users inspect the rows behind the aggregate. The details query can be a key from the report’s queries dict or a direct Cypher string. It receives the same params as the panel query and supports the same return formats as a table panel.
reports:
  dashboard:
    name: Dashboard
    queries:
      cves-severity-fraction: |-
        MATCH (c:CVE)
        WITH COUNT(DISTINCT c.id) AS denominator
        MATCH (c:CVE)
        WHERE c.base_severity = $base_severity
        RETURN count(DISTINCT c.id) AS numerator, denominator
      cves-severity-fraction-details: |-
        MATCH (c:CVE)
        WHERE c.base_severity = $base_severity
        RETURN c AS details
    rows:
      - name: Progress panels
        panels:
          - cypher: cves-severity-fraction
            details_cypher: cves-severity-fraction-details
            type: progress
            params:
              - name: base_severity
                value: CRITICAL
            caption: Critical CVEs
            w: 3
            h: 4
            threshold: 0